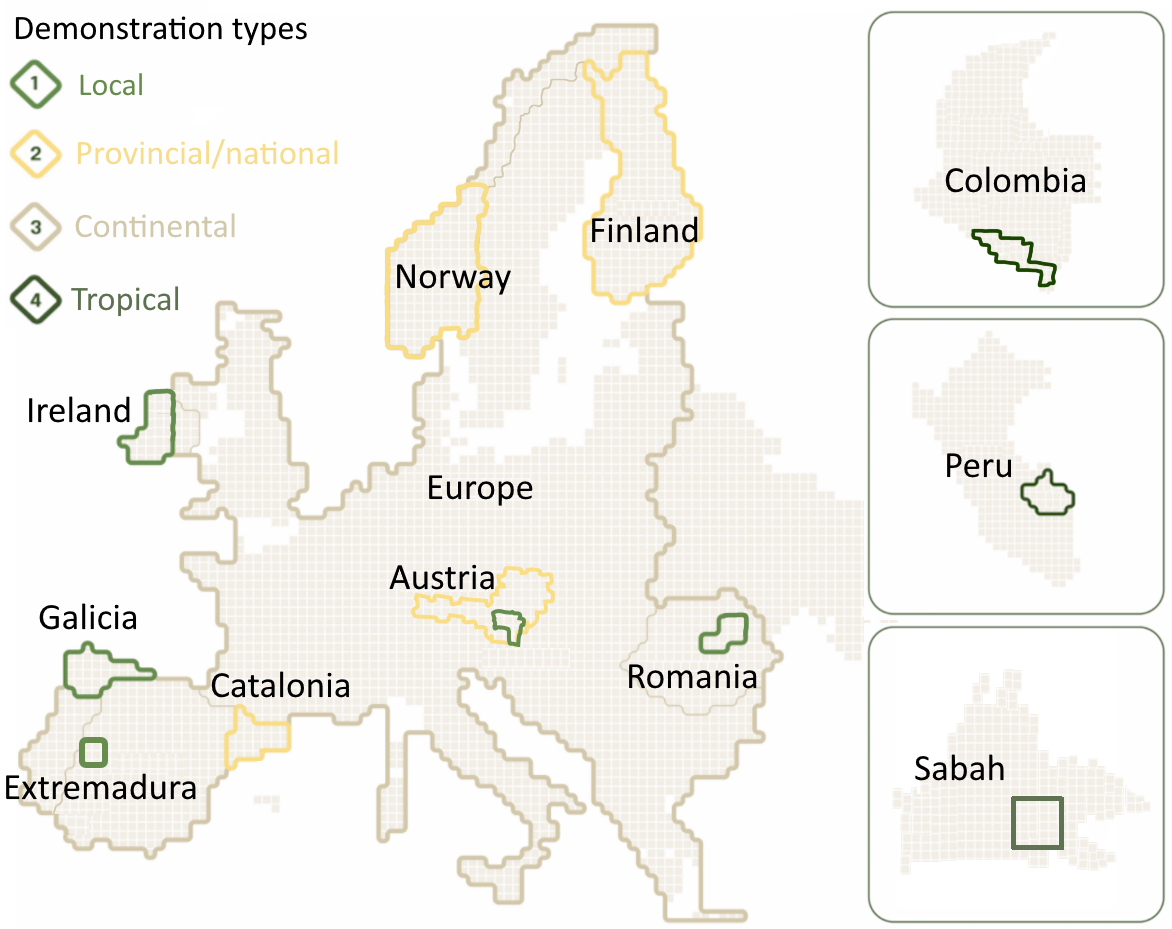
Use Case Demonstrations
Use case demonstrations
During the main phase of the project (July 2021 – June 2023), nine use case demonstrations were conducted (Austria/Styria, Catalonia, Europe, Extremadura, Finland, Galicia, Ireland, Peru and Romania). In the project continuation (May 2024 – November 2025), the Catalonia and Europe demonstrations were developed further and additional use case demonstrations were established in Norway, in Colombia and in Sabah (Malaysia).
The demonstrations can be grouped into three different categories:
- Local level demonstrations designed to meet private company requirements, and other stakeholders focusing their activities on small areas.
- Provincial to national level demonstrations aimed primarily at administrative agencies helping to meet their monitoring and reporting requirements, often utilizing National Forest Inventory field sample plots as an integral part of the methodology. Large scale REDD+ projects also fall into this category.
- Continental level demonstration in Europe, aiming to meet the needs of international organizations and other communities requiring continental level information.
The main EO datasets used were ESA’s Sentinel-1 C-band radar and Sentinel-2 optical satellite data, supported by auxiliary datasets (e.g. digital elevation models, weather data etc.). In addition, JAXA PALSAR-2 L-band radar data was used in the European wide demonstration and the PALSAR-2 yearly mosaics in Norway and Peru.
The characteristics of the demonstrations are provided below, with links to openly available prototype output products.
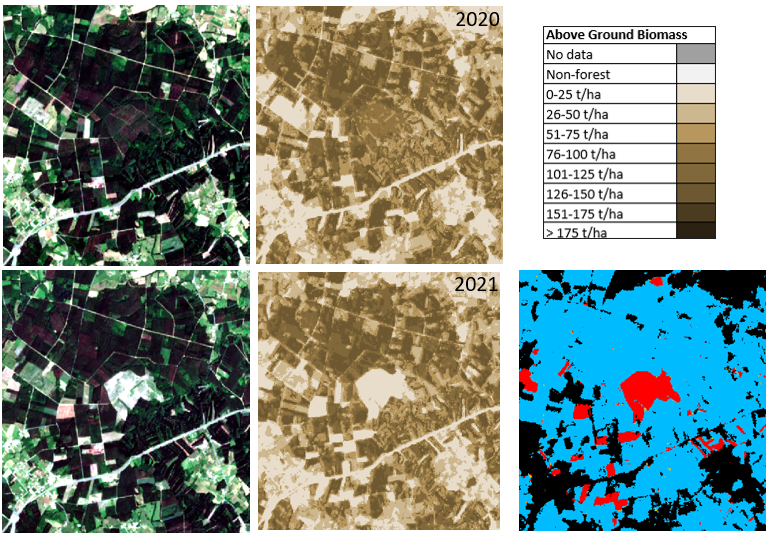
Local level demonstrations
- Locations: Extremadura (Spain), Ireland, Galicia (Spain), Romania, Sabah (Malaysia) and Styria (Austria)
- Methods: k-NN or Probability, Autochange and PREBAS
- Reference data: Field sample plots measured by the users
- Outputs: User defined selection of forest structure maps, biomass and growth maps and forest change maps for three time-steps with yearly interval (expect in Extremadura 2017 and 2022, and in Styria 2015-2018-2021)
- Example to the right: Sentinel-2 imagery and above ground biomass estimates in Galicia. Change product 2020-2021, with cleared areas in red.
Provincial to national level demonstrations
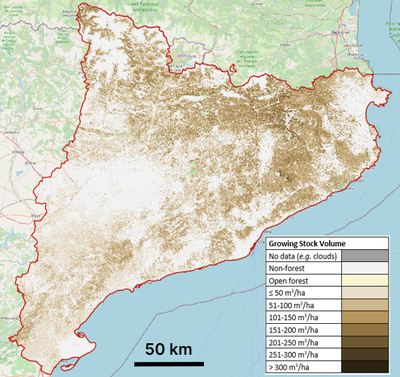
- Locations: Austria, Catalonia (Spain), Colombia, Finland, Madre de Dios (Peru) and Norway
- Methods: k-NN, Probability, Unet, Autochange, PREBAS and Joanneum Researh NRT change detection method (Austria)
- Reference data: National Forest Inventories and other large scale field plot measurement campaigns. Two stage sampling (field + VHR) in Colombia.
- Outputs: Selected forest structure and biomass maps (varying between demonstrations) and forest change maps for two years. Near-real-time change mapping in Austria
- Example to the left: Growing stock volume map for Catalonia 2020.
Catalonia and Finland prototype output products can be viewed and downloaded at the FCM output product portal. Delivery notes describing the data, methods and output product accuracy is also shared through the same link. Austria outputs can be viewed at the ESA Green Transition Information Factory portal.
The two new use case demonstration areas in Colombia and Norway implemented in the project continuation (May 2014 – November 2025) enabled development and demonstration of new approaches.
The Norway use case, involved with compliance carbon monitoring, allowed evaluation of a novel forest structure mapping approach (UNet model transfer), improved accuracy assessment approaches and model-assisted estimation. Data assimilation approach for a 6-year time frame was also evaluated in the area that covers the Southern part of Norway, south of Trøndelag region (inclusive).
The Colombia use case, involved with voluntary carbon markets, enabled showcasing a two-step sampling approach supported by forest stratification. This approach enabled provision of biomass estimates for selected areas with known confidence intervals. The demonstration area covered an ongoing REDD+ project and was over 3.7 Mha in size.
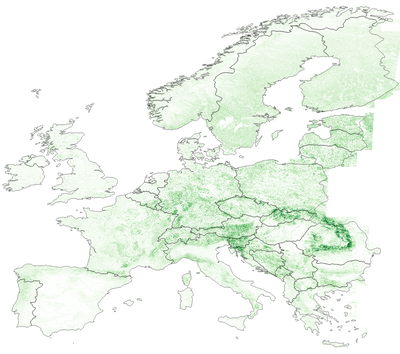
Continental demonstration
- Location: Europe (extended EU)
- Methods: BIOMASAR and Autochange
- Reference data: Opportunistic sample of publicly available National Forest Inventory sample plots, supported by LiDAR estimates in selected locations.
- Outputs: Growing stock volume, above and below ground biomass as well as forest change maps
- Example to the right: European wide above ground biomass map for 2020, in 20 m spatial resolution.
Output products can be viewed and downloaded at the FCM output product portal. A delivery note describing the data, methods and output product accuracy is also shared through the same link.
During the project continuation, the European demonstration was extended to include a series of four biomass maps (2017-2020-2021-2023). The change detection demonstration was conducted for 2020-2021.