FCM toolset
High level concept
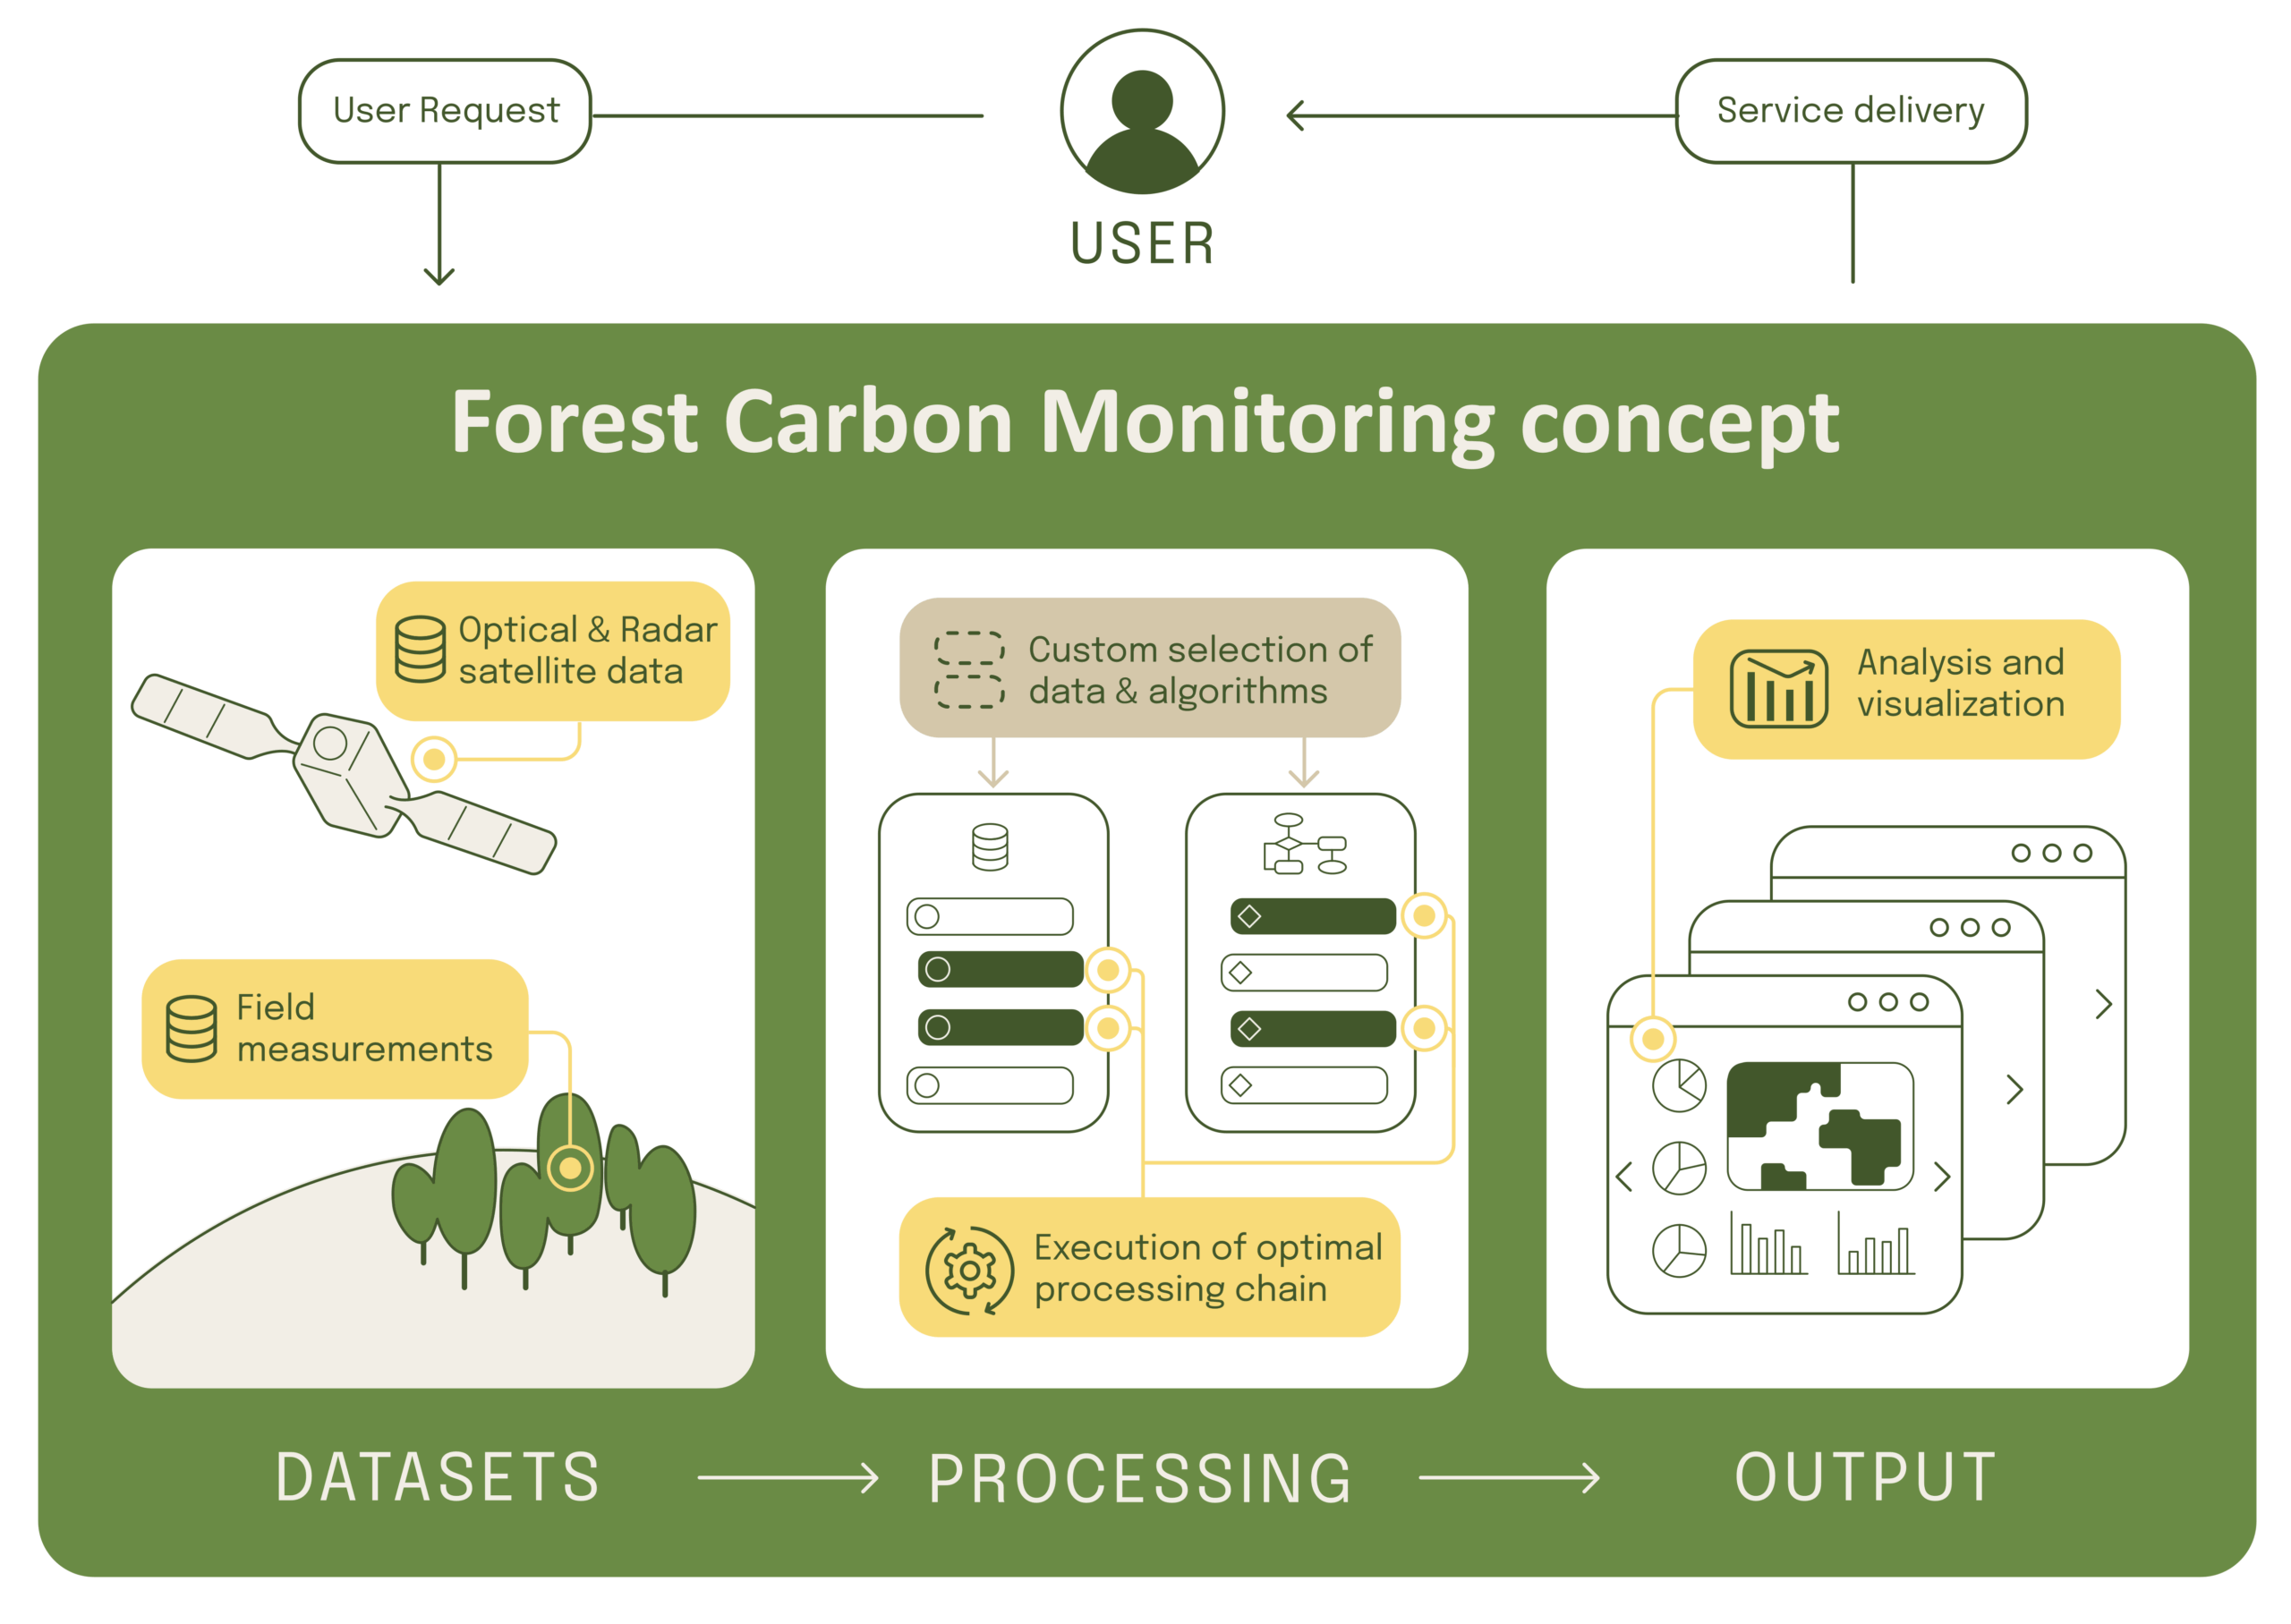
The Forest Carbon Monitoring (FCM) toolset concept aims to integrate remotely sensed datasets, field measurements and online processing power to maximize their synergy to best meet the needs of different types of users. The potential users of the tools range from governmental entities and international organizations to the private sector, which are considered central actors in fighting climate warming.
Forest structural variables (such as height, diameter, volume) are predicted in high 10-20 m spatial resolution using optical and radar satellite data with ground reference data and supporting datasets. Biomass is either predicted directly or process based ecosystem models are used to transform the structural forest variable values to biomass and equivalent CO2 values.
FCM tools portfolio and access
The current selection of tools included in the portfolio is presented below. In addition, data assimilation service to create consistent time series of EO based predictions is provided. Full descriptions of the algorithms underlying the tools and the datasets used in the demonstrations can be found in the Algorithm Theoretical Basis Document (ATBD). It also provides examples of the level of performance achieved in the use case demonstrations.
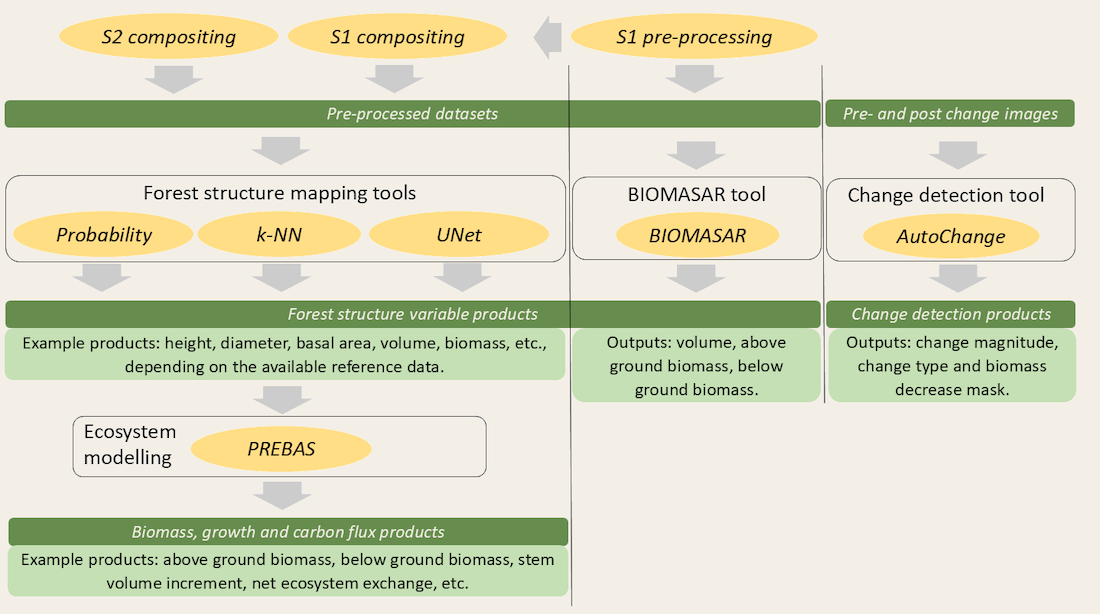
The figure below illustrates typical processing pipelines to derive desired output products. Forest structural variables predicted by Probability, k-NN or Unet can be used as input for PREBAS process based ecosystem model to derive biomass and carbon flux predictions and conduct future forecasting. Biomass can also be directly predicted with the forest structure mapping tools if reference data on biomass is available. The BIOMASAR method (used also in the ESA CCI Biomass project to produce global biomass maps) has been fine-tuned for higher resolution mapping in Europe. The Autochange tool can be used for change detection.
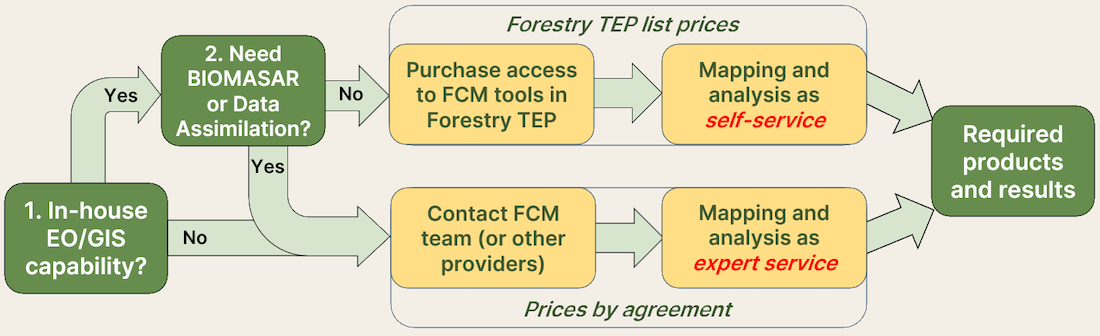
The figure below provides a flow chart on how to access the Forest Carbon Monitoring tools. Most of the tools can be run on the Forestry TEP platform as self service, benefiting from the powerful servers directly connected to the CREODIAS data repositories. Information on the subscriptions can be found here. The tools are also available through the ESA Network of Resources (NoR) portfolio, allowing users to apply for free-of-charge use of the tools for research and pre-commercial purposes. The BIOMASAR and Data Assimilation services are only provided as expert services by Gamma Remote Sensing and Yucatrote, respectively. If you are interested in using any of the tools or services, the best way to start is by contacting us through the Forestry TEP contact form. We will be happy to provide further information.
Output products
The Forest Carbon Monitoring Use Case demonstrations have produced three different types of products to support users in their forest biomass and carbon monitoring: Forest structure variable products, Biomass and growth products and Change products.
The selection of feasible forest structure variable products depend heavily on the available field reference data. These can range from basic volume or biomass prediction to a full range of forest structure attributes including e.g. diameter, basal area, height, species compositions etc. Further biomass and carbon flux predictions, as well as future forecasting can be performed with the PREBAS model in areas where it has been calibrated for.
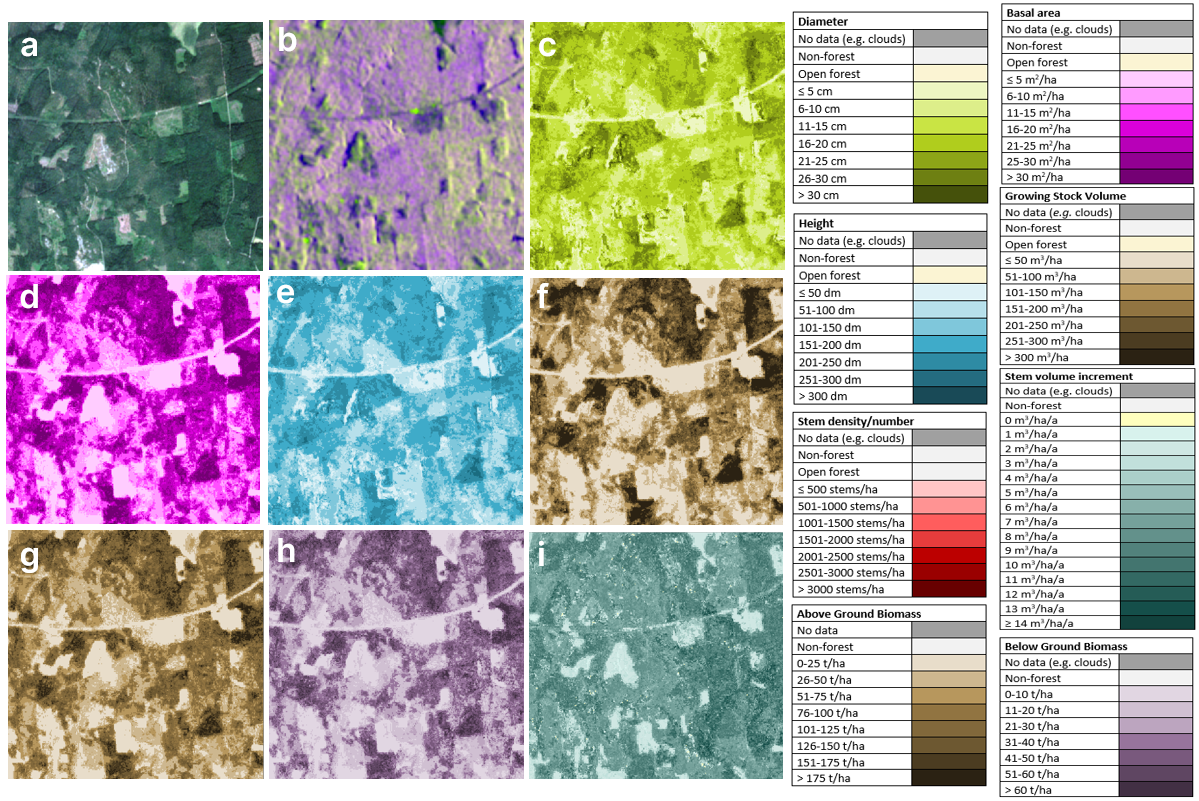
Examples of output products produced in the Use Case demonstrations are provided below. These image samples are from Finland. The size of the samples is around 2.5 x 2.5 km. Subsets illustrate (a) Sentinel-2 real colour image, (b) Sentinel-1 (VH, VV, VH-VV), (c) Diameter, (d) Basal area, (e) Height, (f) Growing stock volume, (g) Above ground biomass, (h) Below ground biomass and (i) Stem volume increment. More prototype product examples can be found on the ‘Demonstrations’-page, on a blog post about the prototype products, on a blog post about the demonstrations and on the FCM product portal.