During the past six months we have been busy running hundreds of tests with different Earth observation (EO) data combinations and prediction algorithms in the seven testing sites in Europe and Peru. These tests were conducted to allow selection of optimal EO data and method combinations for the demonstrations to be implemented during the second year of the project. The main datasets included Sentinel-2 optical data as well as Sentinel-1 C-band, ALOS-2 PALSAR-2 L-band and TanDEM-X interferometric X-band radar data. In addition, ICESat-2 was used in a supporting role. The algorithms included among others the Probability method by VTT, k-Nearest Neighbour (k-NN), Support Vectors Machine and Random Forest as well as the BIOMASAR biomass retrieval algorithm by Gamma Remote Sensing.
Vast amount of information was accumulated during the testing phase. It will take some time to structure and publish all the findings. Some preliminary results were already presented at the ESA Living Planet Symposium in May (download Antropov et al. poster). The next opportunity to hear about the results will be in the IGARSS 2022 conference mid-July 2022. In time, we also aim to publish journal articles of the main results. But since we do not want to keep you in suspense too long, we highlight here some of the key findings that affected the selection of the data and algorithm combinations to be used in the demonstrations.
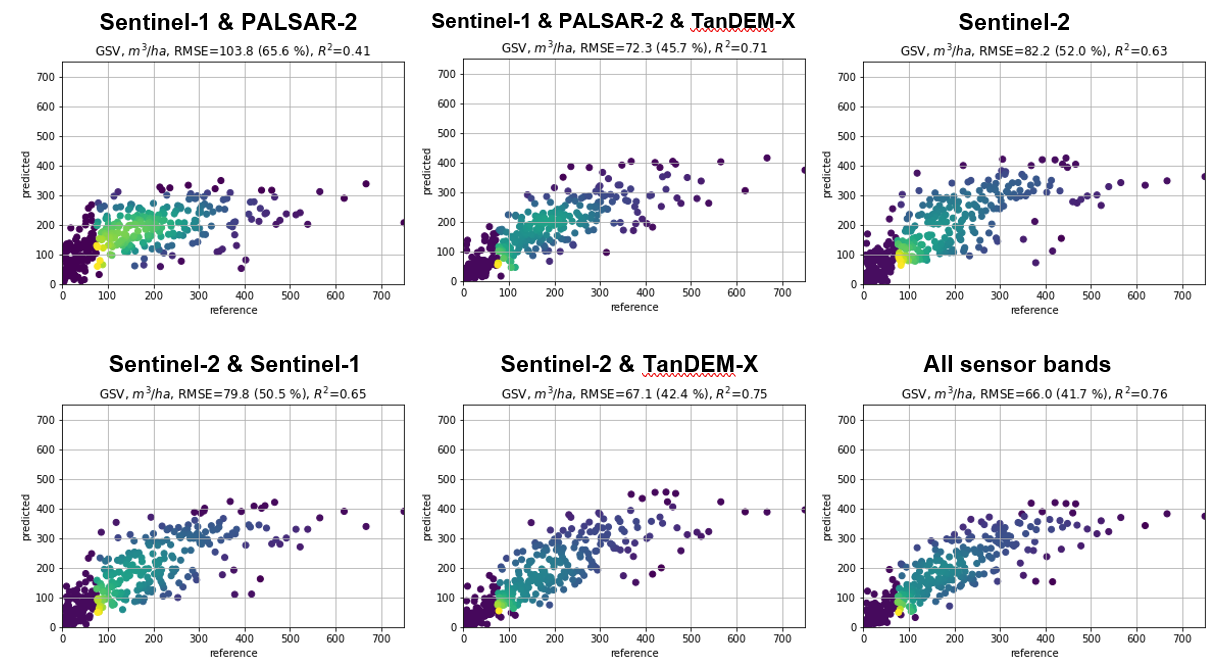
Figure 1. Growing stock volume (GSV) predictions with various combinations of EO data in a testing site in Southern Finland. k-NN method.
The data combination tests showed the strength of data fusion from multiple sensors, particularly combining optical and radar data (Figure 1). The strongest single datasets for estimation of the wide range of forest structure variables (height, diameter, basal area, volume and species composition) was Sentinel-2 optical resolution imagery, reaching typically RMSE of 20-60% of the mean for different forest structure variables in the seven testing sites. Combination of Sentinel-2 data with Sentinel-1 or PALSAR-2 radar data generally improved the results. However, the strongest improvement was achieved by including also TanDEM-X radar data. The X-band interferometry derived metrics, such as coherence and canopy height model, helped particularly in prediction of height (Figure 2) and growing stock volume. Plot level accuracies of RMSE 20-40% could be achieved across the testing sites for different variables. However, limited availability of X-band radar data complicates its use for operational purposes. Therefore, the demonstrations during the second year will be conducted with varying combinations of Sentinel-1, Sentinel-2 and PALSAR-2 data.
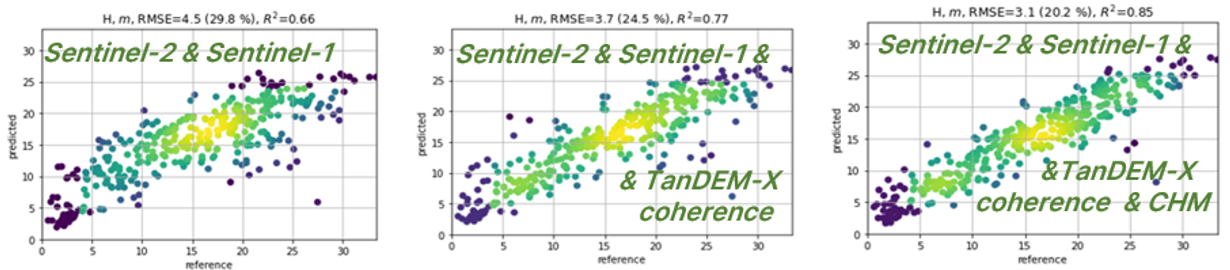
Figure 2. Height predictions with various combinations of EO data in a testing site in Southern Finland. k-NN method.
The methods comparison enforced the idea that the Forest Carbon Monitoring platform should be able to offer a range of methods to provide optimal results for different use cases and user needs. As a physical method the BIOMASAR approach is a powerful tool for large area forest volume and biomass mapping with consistent methodology and without field data from the area of interest. However, empirical methods with representative field data measurements from the area of interest provide more flexibility to meet varying user needs (e.g. related to the required forest variables) and maximize the potential of available datasets. With a range of methods from fully automated physical and empirical methods to semi-automated empirical method, the platform will be able to respond to different user request with varying interest variables, data availability and geographic interest areas.
All of the tested methods produced satisfactory results. The best accuracies for single variable estimation were achieved with Random Forest method. However, methods that estimate multiple forest variables at the same time (like the Probability and k-NN) were found more suitable for the platform as they tend to preserve the relationships of the variables better. The strength of the Probability approach is the possibility of visual evaluation and manual modification of the model, which enables its use with very limited and unrepresentative field reference data. The findings of the methods comparison allowed drafting a preliminary design of a decision tree for methodological selection for the envisioned Forest Carbon Monitoring platform (Figure 3).
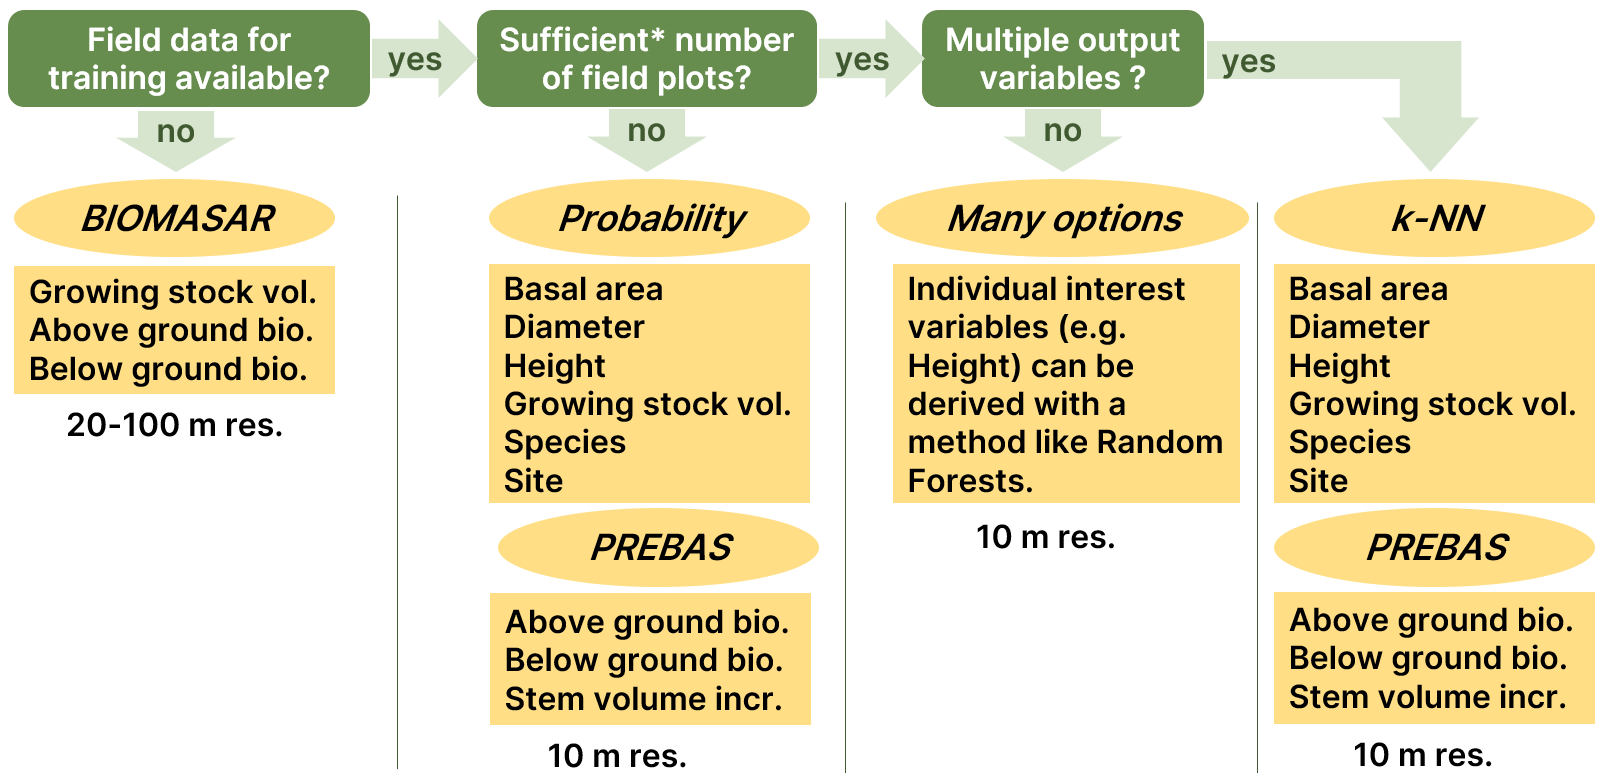
Figure 3. Preliminary design of a decision tree for methods selection in the Forest Carbon Monitoring platform. *Typically at least 100 plots, but the characteristics and representability of the field dataset needs to be evaluated case-by-case.
This decision tree will be tested in the demonstration phase of the project and can be further refined in the future. The European demonstration with no representative field reference data available over the large interest area will be conducted with the BIOMASAR approach, while the rest of the demonstrations will use empirical methods. The Finland demonstration uses the Finnish Multi-Source NFI (MS-NFI) maps, which have been produced with the k-NN approach. In addition, the k-NN will be used at least in Romania and Catalonia, with high number of field plots available. The rest of the demonstrations are planned to be conducted with the Probability approach.
In the coming weeks we will update the “Platform”-page in the website with information on the data and methods used on the platform. We will also provide some example images of the output products expected from the demonstrations. The updates will be highlighted also here in the blog. Stay tuned for the exiting sample products to come out soon!